Dec
Since commodities are all derived from some natural resource, it is important to understand those natural resources, their production practices, and the underlying market conditions. Without a firm understanding of these underlying principles, it is very hard to have a firm understanding of what is driving the markets.
In the grain and oilseed market primer, we will cover the basic production practices of the three major grain and oilseed markets. We will also touch on the major demand drivers and some topics of interest for the future.
Field Corn
The granddaddy of them all, field corn. If you grew up in the midwest, the south, or even parts of the northeast you have seen fields of corn at one point or another in your lifetime. Field corn is planted in the major production regions between March and May every year and harvested between September and October. The crop pollinates around the middle of July, which usually coincides with hot, dry, weather and almost certain price volatility.
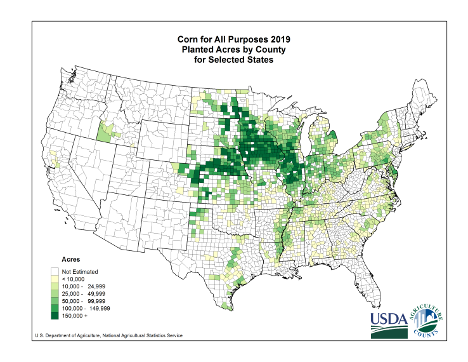
Source: USDA NASS
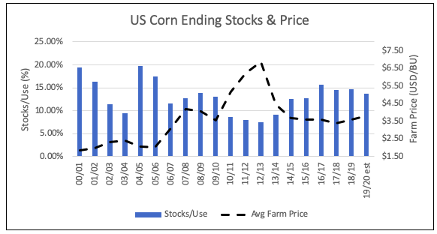
This summer time price volatility in corn is because corn is a seasonal production commodity in the US. This means that it is only grown during the summer months, so any detrimental weather patterns that occur could result in a tight corn supply for the entire next year.
Likewise, corn planting and harvest are also important times (as anyone who lived through the crop year 2019/20 will tell you). If there is a wet spring and the crop is planted too late it can cause uncertainty and volatility. Likewise, if the fall is cold and/or wet is can also cause uncertainty and volatility.
Recent Supply and Demand Trends
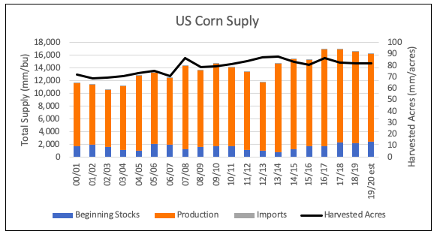
Since the 2000/01 crop year the US has planted an average of 86 million acres of corn each year and harvested an average of 79 million acres. Each year, producers have to decide how they would like to allocate their available acres. For most of the midwest, this means choosing between corn and soybean. As you move further north into North Dakota, there are a few more subsitute opportunities in the form of beet sugar, spring wheat, edible beans, etc.
To get a sense for the year to year acreage substitutions between corn and soybeans, most market participants will look at what’s called the “Bean Corn Ratio” or the “Bean Corn Spread.” The bean corn ratio is simply the price of November Soybean futures divided by the price of December Corn futures. As a general rule of thumb, the average of the ratio is around 2.35. Anything above a 2.35 tends to encourage soybean plantings and anything below tends to encourage corn plantings.
Over the last 20 years or so increases in technology have allowed harvested US corn acres to remain relatively stable around the 80 million acre level, while total supplies have increased almost 40% from 11.6 billion bushels in the 2000/01 crop year to ~16.2 billion bushels in the 2019/20 crop year.
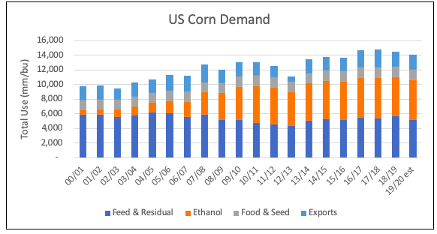
As the production of corn continues to increase, the demand for corn has increased as well. Over the last 20 years the demand for US corn has increased roughly 55% – predominantly driven by the ethanol mandates of 2005 and the increase in US corn ethanol production.
Since corn is a seasonal production commodity, the market focuses heavily on the Stocks to Use ratio. The Stocks to Use ratio is the amount of ending stocks (or supplies) left over at the end of the marketing year divided by the the total use for the marketing year. This ratio gives the market a good idea of how much crop is being carried from one marketing year to the next, and also tends to inversely correlate fairly well with price movements.
Soybeans
In the major production regions soybeans are planted a bit later the corn, but are also harvested a bit later than corn. Soybeans tend to be planted from April to June and are harvested around October. With a later planting than corn, soybeans also have a later pollination. Soybeans tend to pollinate around August, which means that they follow the same hot, dry, weather patterns and price volatility that corn does.
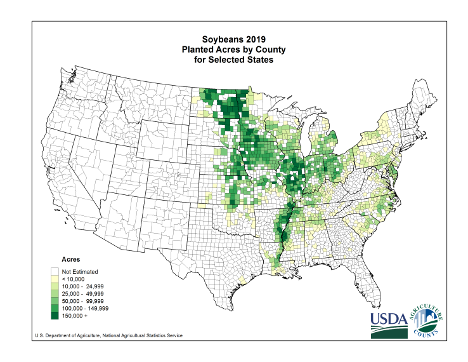
Source: USDA NASS
Also like corn, soybeans are a seasonal production commodity, so any adverse weather impacts during planting, growing, or harvest puts an entire 12 month supply of the crop at risk.
Recent Supply and Demand Trends
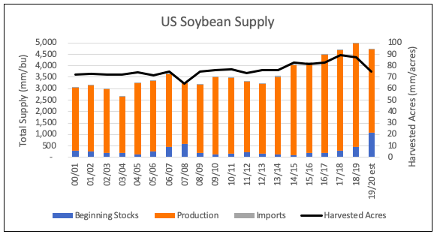
Since the 2000/01 crop year, the US has averaged roughly 77 million acres of soybeans planted each year and harvested an average of 76 million acres. Producers of soybeans also have to weight the economics of planting soybeans and one of the alternatives on an annual basis. This is commonly done using the Bean Corn Ratio that we referenced above.
Over the last 20 years technological advancements in agricultural have allowed soybean acres to stay relatively flat in the 75 million acre range, while soybean production has increased almost 35%.
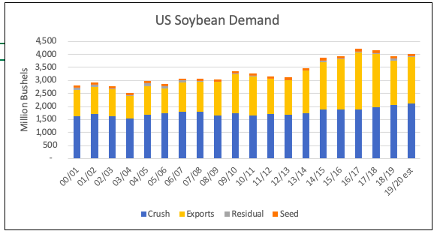
This increase in production has lead to the need for new demand channels. These demand channels have historically been through exports of US beans to china, but more recently the US has created biofuel mandates as well. These biofuel mandates, although not impacting the bean directly, spur demand for oil which is a byproduct of the soybean crush.
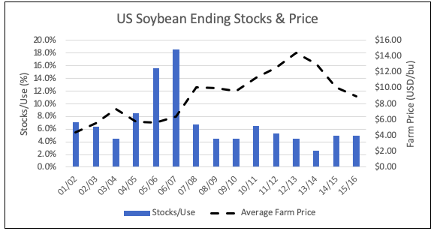
Soybeans are a seasonally produced commodity in the US, which means that the market focuses on the Stocks to Use Ratio as a guide for prices. As you can see from the below, there is an inverse relationship between soybean prices and it’s Stocks to Use Ratio.
Wheat
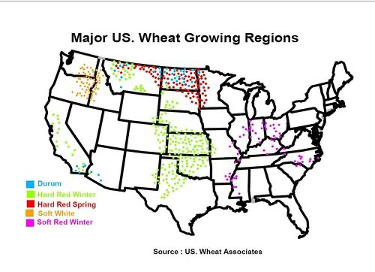
There are three main types of wheat grown in the US – Hard Red Winter Wheat (HRW/KC Wheat), Soft Red Winter Wheat (SRW/Chicago Wheat), and Hard Red Spring Wheat (HRS/Minneapolis Wheat). Each of the three types of wheat have their own futures contract that roughly correlates to the location of where they are grown
There are also a few different types of minor wheat classes, such as Durum and White Wheat, but they do not have futures contracts.
Hard Red Winter Wheat (HRW)
HRW wheat is planted in the fall, lays dormant over winter, and is harvested in the spring. This is the predominant bread flour in the US due to its relative higher protein content being idea for bread making.
HRW Wheat is sometimes called Kansas City Wheat both because of the growing area being around the Kansas area and because the Kansas City Board of Trade was the first exchange to have HRW futures.
Soft Red Winter Wheat (SRW)
Like HRW wheat, SRW wheat is planted in the fall, lays dormant over winter, and is harvested in the spring. SRW wheat is the lowest protein of the three major classes which makes it ideal for cakes, cookies, and crackers.
SRW Wheat is also called Chicago wheat because it was first traded on the Chicago Board of Trade.
Hard Red Spring Wheat (HRS)
Unlike the winter wheat classes, HRS wheat is planted in the spring and harvested in the early fall. HRS has the highest protein content of the three major classes, making it great for bagel making. It is also used as a blender with lower protein wheat to boost the overall protein content.
HRS Wheat is also called Minneapolis wheat because the Minneapolis Grain Exchange is where the futures contracts are offered.
Protein Premiums & Class Spreads
It doesn’t take long for wheat market participants to hear and learn about protein premiums. Because various baking applications require differing amount of gluten (wheat protein), the three different classes of wheat are frequently blended to achieve an optimal protein content. This intertwines the supply and demand of the three different classes, and also creates a relative relationship for protein premiums.
There is also a link between protein and yields. When the weather is great and the crop is not stressed when it is growing the yields are usually high, but protein content is usually lower. vice versa, when the crop receives some dry weather, or other stress, yields will suffer, but protein content will be higher.
The inverse relationship between protein and yields means that sometimes the different classes will move in different directions. In the example above, assuming you had a great year with little stress, you might see SRW wheat decline is prices due to the ample supplies of low protein wheat, but HRS wheat will rise due to the lack of high protein wheat.
Because of the market dynamics between classes, it is common to hear market participants reference the difference basis values between 13% protein wheat and 12% protein wheat, or any of the other common protein classes. You will also hear market participants talk about the futures spreads between the three different classes as they are also an indication of the value being offered for different levels of protein.