05
Aug
Aug
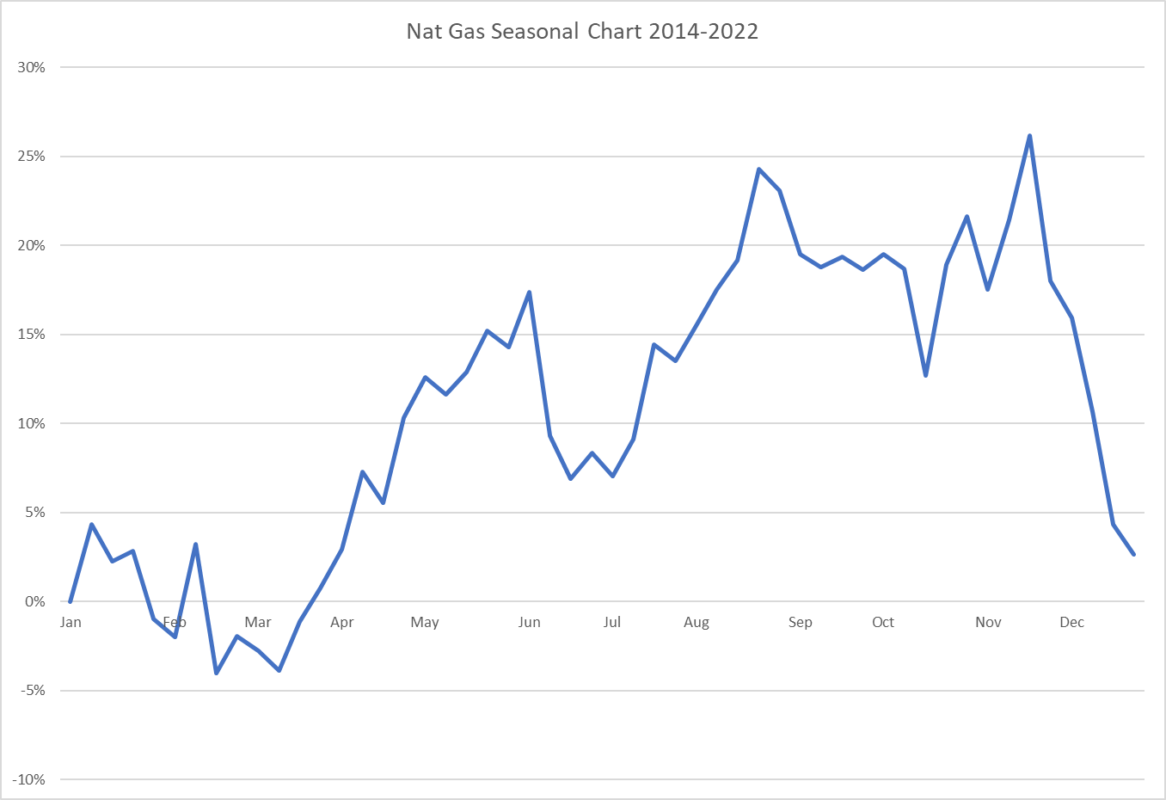
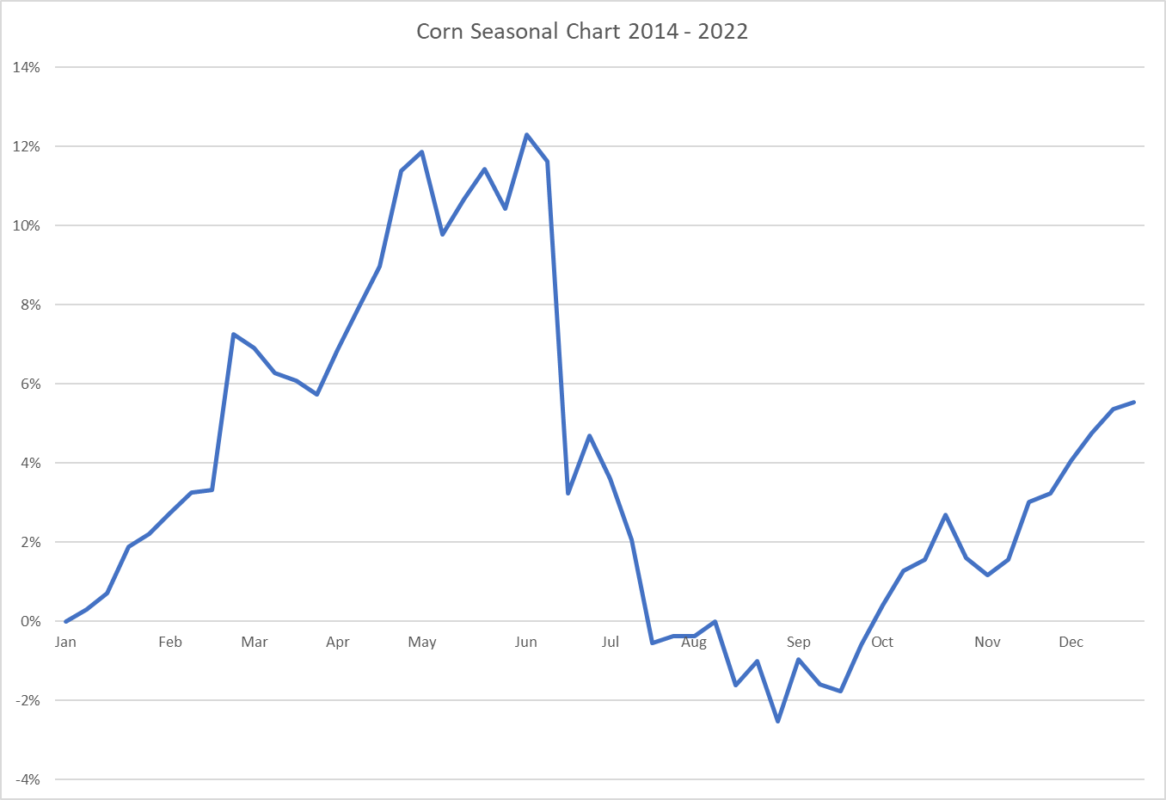
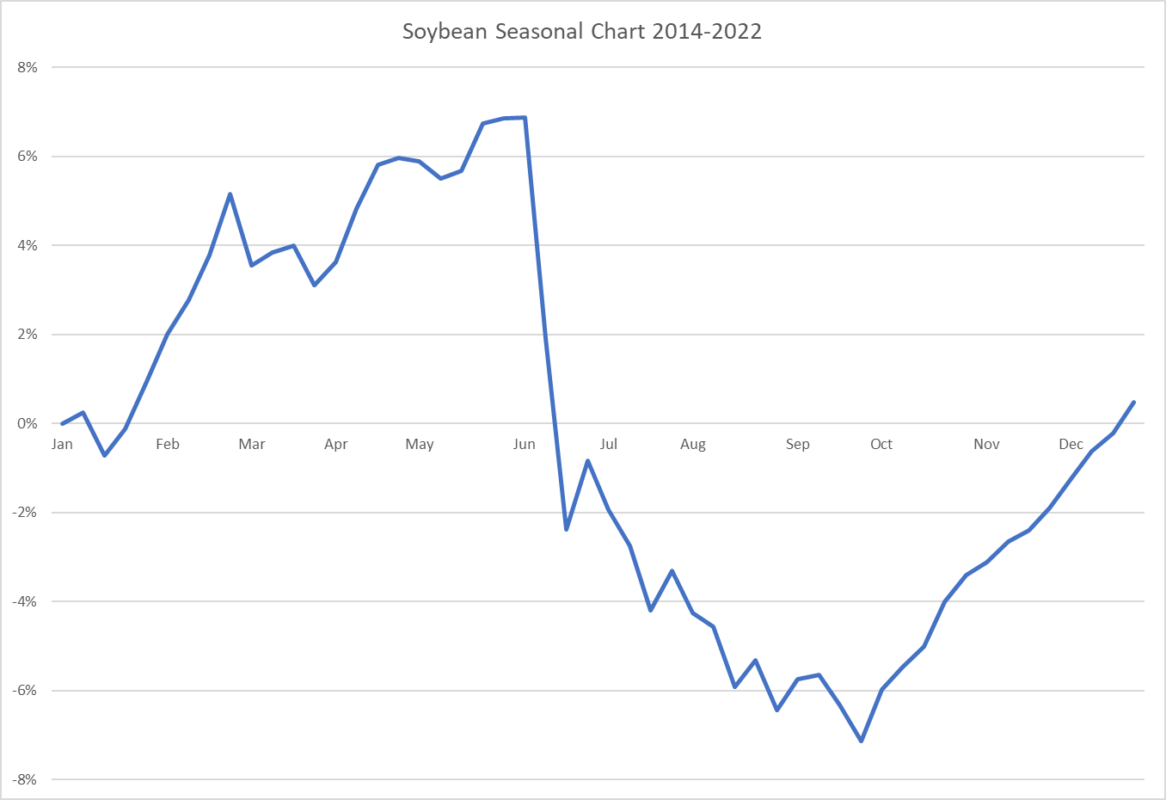
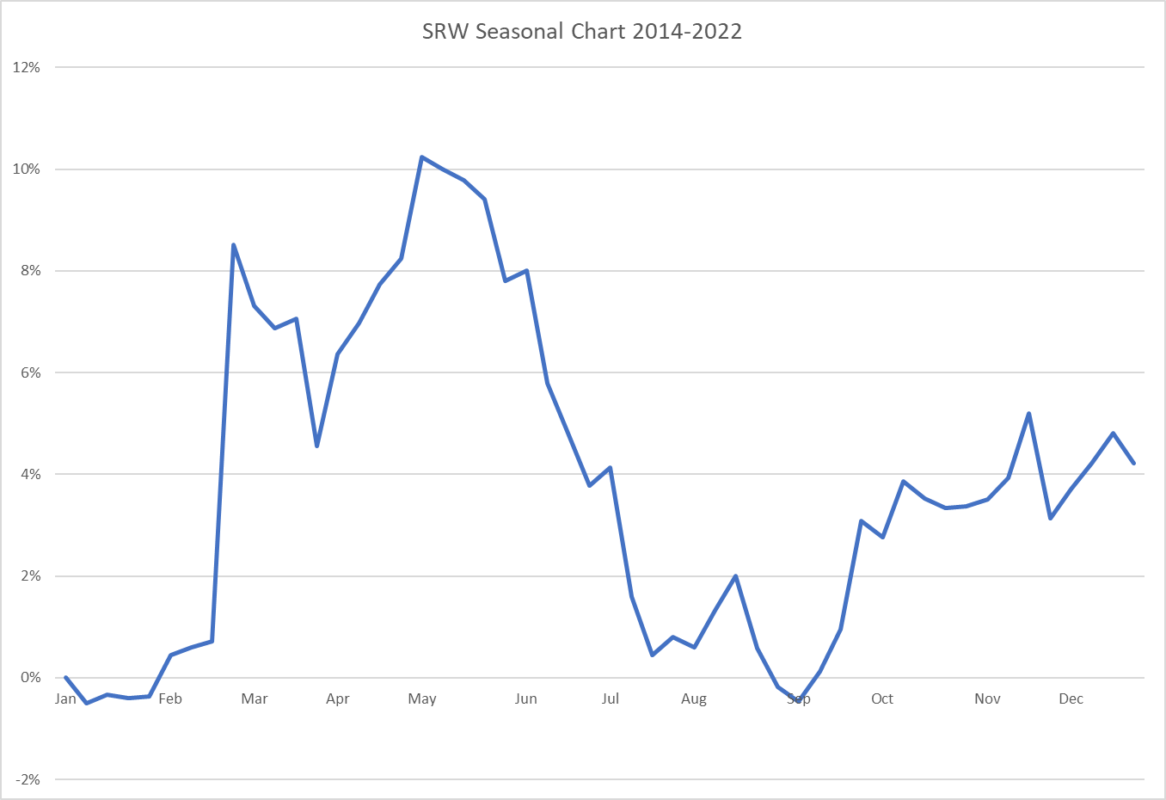
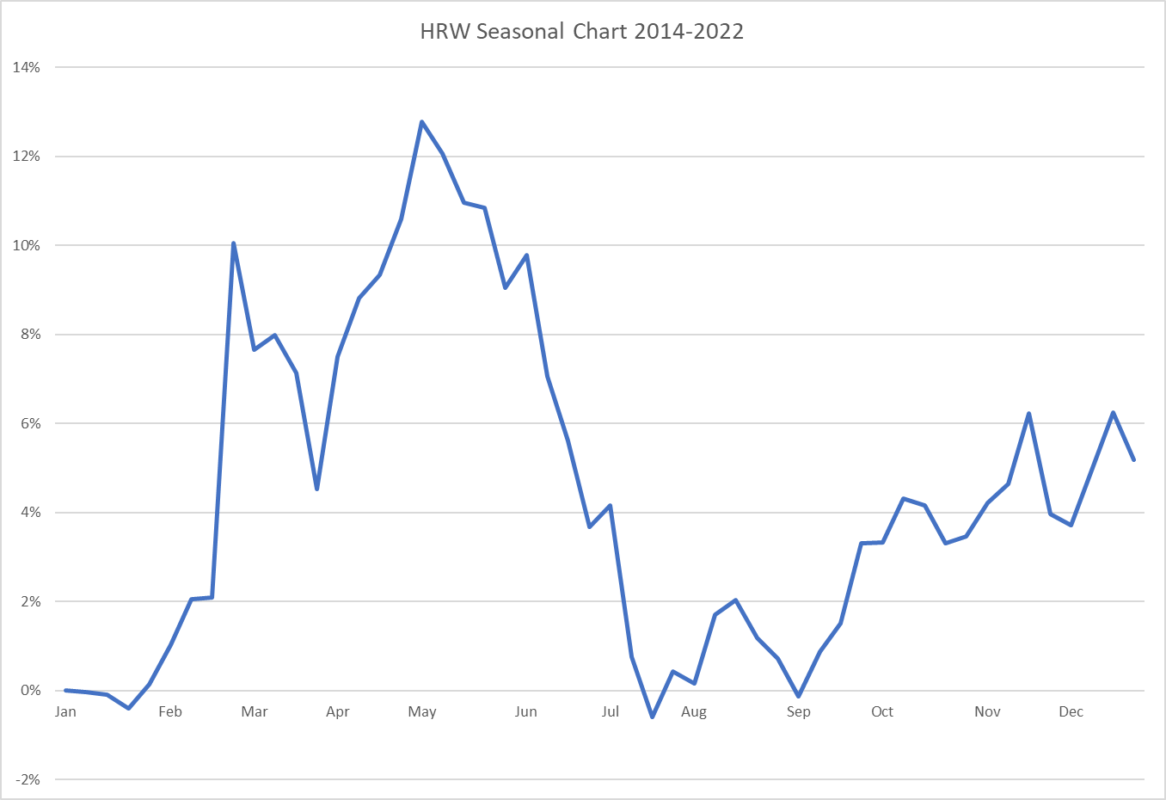
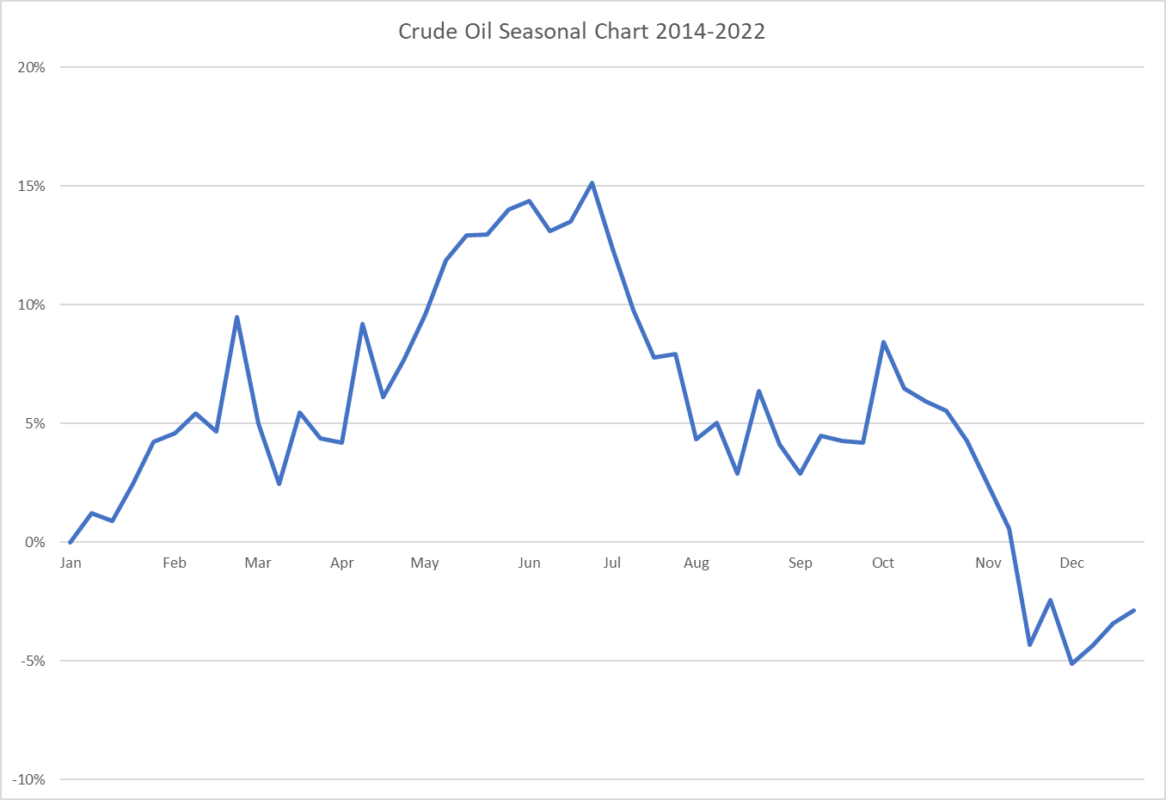
Below are updated seasonal charts from 2014 – 2022. The charts have all been “baselined” using the first trading day in January as the baseline. The percentage changes from that point forward are all relative to the price on that first trading day in January.
Corn Seasonal Chart:
Soybean Seasonal Chart:
SRW Wheat Seasonal Chart:
HRW Wheat Seasonal Chart:
Crude Oil Seasonal Chart:
Natural Gas Seasonal Chart: