
Sep
Quote of the week: “When you can’t control the events in your life, control your reactions. That’s how you regain power.”
Fact of the week: There are parts of Africa in all four hemispheres.
Last Week:
- After all the weather concerns and talk over the weekend, the markets opened flat on Monday night (short trading week). This is not a very good sign if you’re a bull. Typically markets that are headed higher will rally into bullish news.
- On Tuesday (short week) crop conditions were released and surprised the market to the downside. Corn G/E came in down 3 (vs down 2 expected). Soybeans G/E were down 5 (vs down 3 expected).
- Big week over week declines in crop conditions were seen on corn in Illinois and South Dakota with each being down 10. This makes sense given where the dryness has been and the precip anomalies for those areas.
- Beans crop conditions also saw big declines in Illinois, being down 10 week over week. Kansas was down 12, for the largest weekly loser on beans.
- The Australian USDA counterpart, ABARES, lower their crop expectations due to the El Nino impacts – mainly the heat and lack of rainfall. Their current forecast is for wheat production to fall to 25.4M mt in 23/24, a decline of 36% YoY. Word of caution don’t just take the 36% at face value. Yes, their production is declining, but with the La Nina impacts of the last few years, they have had record crops. Their 10-year average production is ~26M mt, so 25.4 is still roughly average. I believe that there is likely some downside left in this number though, but it is unlikely to be as bad as 2018 or 2019 at this point.
- On the flipside, Argentina’s wheat crop is improving year over year, which should net out most of the losses in Australia.
- China and Unknown continue to buy soybeans at a somewhat regular pace. This week Unknown bought 251k mt and China bought 121k mt.
- Again, on the demand front, yes there are regular soybean export sales, but this time of the year you typically expect to see soybean export sales. At this point, the pace of ongoing soybean export sales should not be considered out of the ordinary. Still, something to watch though.
Next Week:
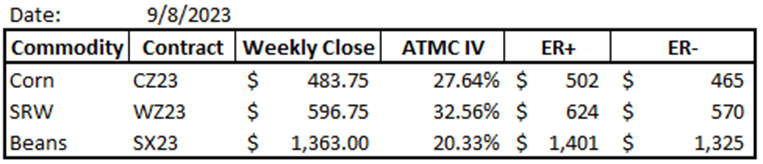
Above are the expected ranges for the upcoming week. ER+ means that if market momentum is higher, we are likely to achieve that price target. ER- means that if market momentum is lower, we are likely to achieve that target. Any move outside of either range would be considered an “outside” week.
- To me, it feels like the market will trade rangebound until/unless 1 of 2 things happen:
- The USDA makes a material change to the balance sheets in the WASDE.
- The market starts to see some harvest data that confirms, or refutes, the current yield estimates. Since material harvest data is still a few weeks out, I would put my money on the WASDE being the thing that has the potential to move the market this week.
- Speaking of the WASDE, market expectations for a few key numbers are:
- 23/24 Ending Stocks
- Corn: 2.134B bushels
- Beans: 213M bushels
- Wheat: 615M bushels
- Yield:
- Corn: 173.4
- Beans: 50.1
- 23/24 Ending Stocks
- Really, I will be paying closest attention to the yield numbers and how demand estimates changes based on yield changes. The corn market should be able to absorb a yield as low as 170 in this report and still maintain a ~2B carryout based on demand changes. Beans on the other hand will likely see more upside pressure if the yield comes in below 50. There just isn’t as much slack demand in the bean balance sheet as there is in the corn balance sheet.
- I could potentially see a scenario this week where if the WASDE bean yield comes out and it bearish the market shrugs it off and says, “we’ll wait for harvest data.” If, on the other hand, the yield comes out and is bullish, the market pushes higher.
- As always, broken record, I am continuing to watch Chinese demand. Again, nothing being bought today should be considered out of the ordinary, but we all know how quickly that can change.
Want this delivered straight to your email every weekend for free? Sign up below.
Trend/Spec Models & Positioning:
Below is a summary of my primary trend model positioning, any weekly changes that were made, and any other spec related longer-term positions that I have on. I occasionally will trade into and out of positions during the week. Those are not reflected here. The purpose of this is to show the longer-term trades and to watch them run their course.
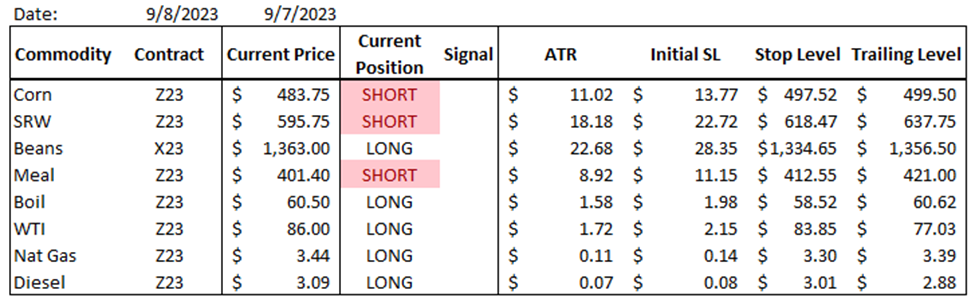
I made a couple of adjustments to my spec/trend models this week:
- My model flipped short Soybean Meal on 9/5/23, so I shorted it at $396.2. I’m currently underwater on the position about $500/contract and a decent way below my stop, which means there’s more pain if the market rallies further. I’m going to let this position ride to see what happens. Longer term, I continue to believe that US meal struggles with expanded crush capacity and a return in normal in Argy.
- I also shorted the SH24-SK24 spread -2.6 this week. The seasonal tendency is for this spread to widen out to roughly -10 on a 5yr average and -20 on a 15-year average. I think we will trend close to the 5yr average based on the way the balance sheet is shaping up, so I’m working an order to take profit at -9.
Previously Mentioned Positions:
- Short Dec Corn at $507
- Long Dec Diesel at $2.37
- Short Dec SRW Wheat $624
- Short NGK24-NGN24 spread at -.209
A quick note on the Short WZ23 @ $624. This is a PRIME example of how taking the emotion out of the market makes all the difference. A few weeks ago, I wrote about how I got a short signal and didn’t take it on SRW and lost the opportunity. A week or so later I got another opportunity to short based on my model and took the trade but wrote about how I thought I would be stopped out because it looked like we were close to a bottom. Well, my emotions were wrong there and I am now in profit by ~30 cents on the trade…
Hedge Models & Positioning:
Below is a summary of my hedge model positioning and any weekly changes that were made. In addition to this, you can also see my full hedge coverage at any time by going to my website, ashlandcommodities.com, and clicking on the 2023 hedge coverage post. As a reminder, my hedge model is a trend reversal model that signals significantly overbought and oversold conditions in the intermediate timeframe. These models typically produce 5-10 buy/sell signals per contract annually.
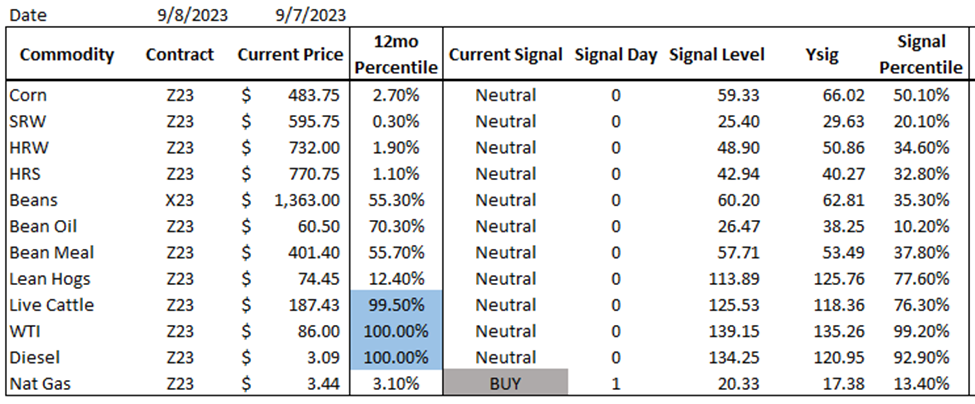
This week, my model gave off a few buy and sell signals. I tend to post these signals on my twitter account the mornings that they occur. In case you missed it:
- Buy SRW Wheat @ $599.25 on 9/5/23
- Buy HRW Wheat @ $725.5 on 9/5/23
- Buy HRS Wheat @ $762.25 on 9/5/23
- Sell WTI Crude @ $85.32 on 9/7/23
- Buy Nat Gas @ $3.44 on 9/8/23 (the signal listed in the table above)
I did not make any hedge changes this week. I contemplated a few adjustments on my Nat Gas positions, but ultimately did not make any changes. Hindsight is 20/20, but I wish I would have lightned up on some of the natural gas futures I own in Q1 when we prices were closer to $4.00/mmbtu. My current coverage is at $3.70/mmbtu (right at the market today), so I’m no worse for the wear, but I could have taken some of that profit and bought back at the original price when the market moved lower.
Want this delivered straight to your email every weekend for free? Sign up below.
Charts:
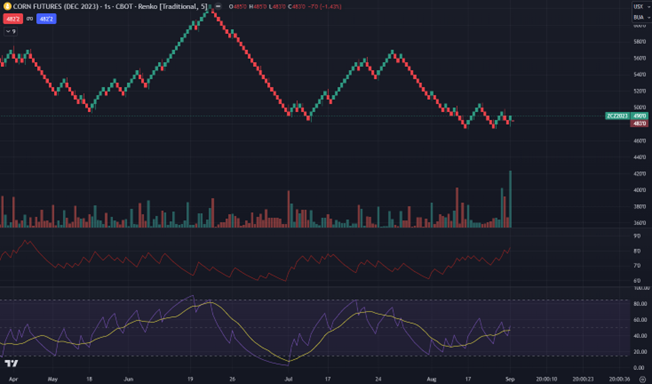
December Corn: 4 hour
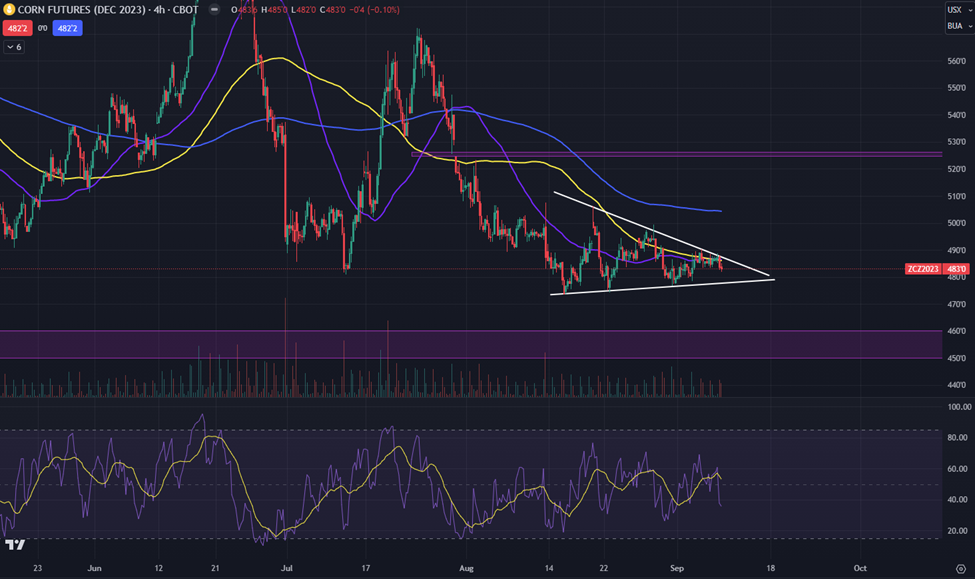
The corn market coiled in a big way this week. It feels like we’re at a place where producers aren’t selling and end users aren’t really buying either. I posted a 5c Renko chart of the corn market earlier this week (below) showing that the last 5c move higher was the largest volume move on the CZ23 to date and required ~314K contracts trading to make it happen… corn is stuck for now.
314k contracts for a 5c move on CZ23:
December Wheat: 4 hour
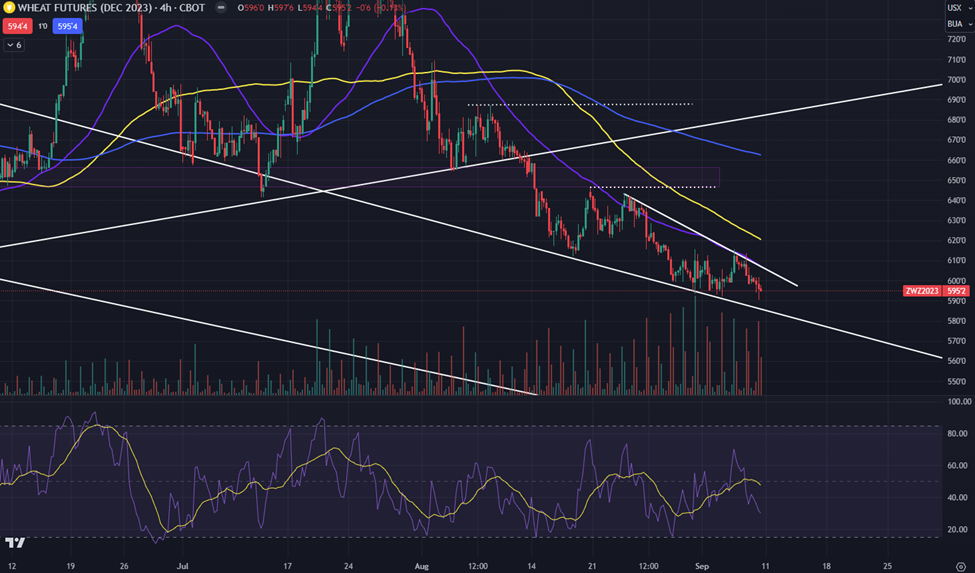
Wheat is also somewhat stuck, but stuck to the floor. Every few days the market seems to put in a new low. Z23/Z24 is trading at ~77% of full carry, we are the cheapest wheat in the world, and we still can’t find demand. That’s a problem. One of the ongoing issues with SRW is the fact that there’s not a ton of uses for it. Yes, you will see people on Twitter say over and over that it’s a ‘substitute’ but the reality is that it’s not in many cases. SRW wheat is good for a few things – cookies, crackers, and cakes. While all countries produce and eat some amount of these products, more of their demand is for higher protein wheats that can be used in bread type products.
November Beans: 4 hour
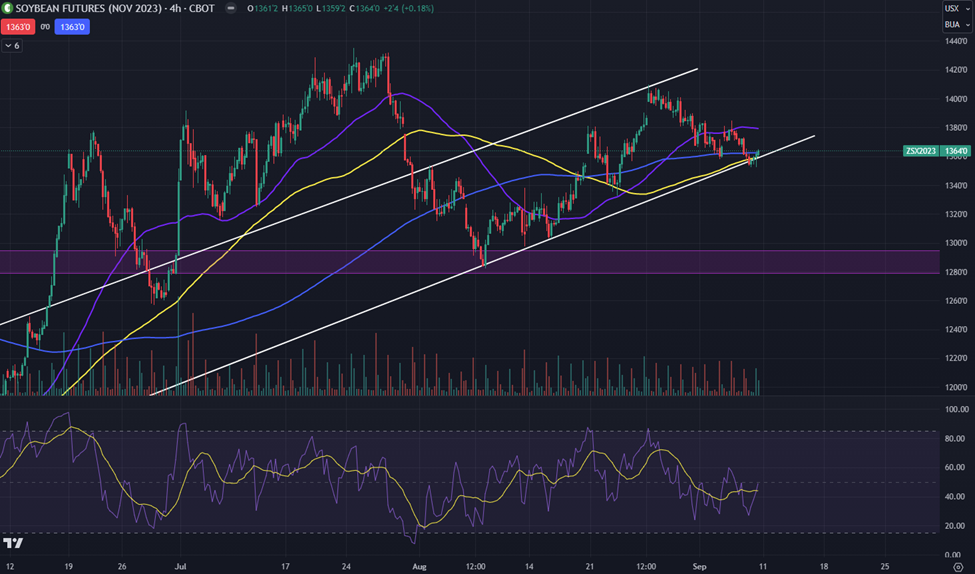
Bean bulls are doing a fairly good job of defending the trend line support. Whether it holds or not will likely depends on the WASDE. AS I mentioned in my comments, I could see a scenario where a bearish bean yield is shrugged off by the market, but a bullish yield causes things to push higher. We will see. If, for some reason, the trend line breaks, 1331 is the next downside target followed by ~1300.
Note: nothing in this post constitutes a buy or sell offer. All information is meant for educational use and is simply used to display various hedging and risk management techniques. If you are interested in trading and or hedging with derivative products, please carefully consider the risks and consult a registered professional.